Hunting a Memory Leak
I work on a large Next.js application and was recently tasked with tracking down a reported server-side memory leak identified on one of our Datadog dashboards. This sort of work was new to me, I'd primarily been building user interfaces in React, but I welcome the opportunity to learn something new and thought the adventure worth sharing.
The Tools
After a little research I put together the following tools to help me track down my leak:
- Node.js inspector: To enable server-side debugging see Next's debugging documentation
- Google Chrome's heap snapshot tool: To visualize memory state
- Vegeta: To automate requests to localhost
The Hunt
To isolate the leak I'd split the page into three sections and capture four sets of snapshots in total: an "All" set reflecting the fully rendered page, and separate "Header," "Body," and "Footer" sets, each reflecting its individually rendered section. For each set I would:
- Use Vegeta to send 50 requests over 5 seconds
- Force garbage collection (GC) before taking the memory snapshot to free memory
- Record a memory snapshot to capture memory state
- Repeat this 5 times and observe memory trends between snapshots using the profiler's Comparison view
Upon completion of my All set I had 5 snapshots that looked like this:
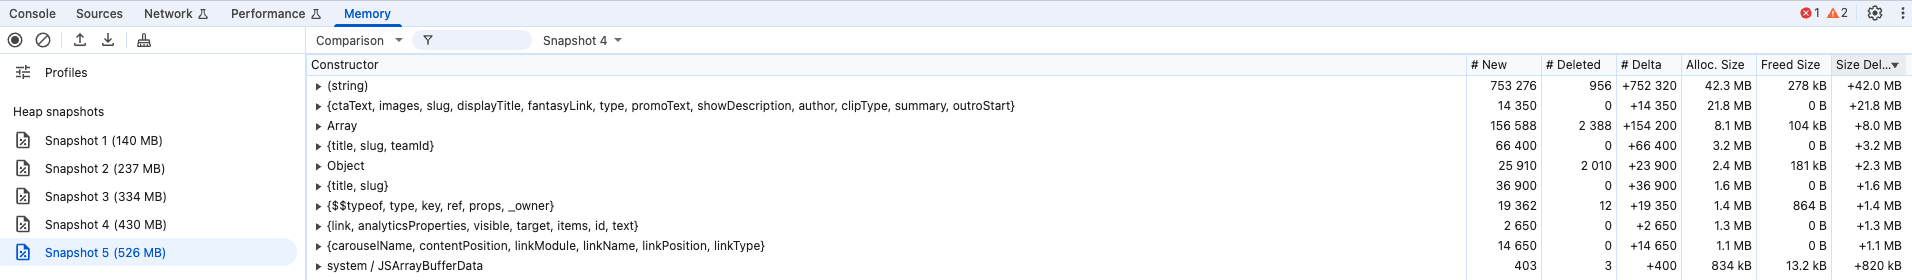
Items in a snapshot with a freed size of 0 and a positive size delta are leak contributors. Also, the growing memory usage values located in parentheses after each snapshot are a clear indication our process will eventually run out of memory. Not ideal.
Next I collected the Footer set and noticed an entirely different trend. The GC appeared to suddenly start working, memory was being freed and memory usage was stable. I could conclude my leak originated from either the body or the header.
The body section also showed no signs of a leak but when I got to the header the original trend returned and the same object: {ctaText, images, slug, ... } appeared the largest contributor. I'd focus on this entry first with the goal of understanding why the GC seemed unable to free this memory.
Circling The Leak
I'd determined the leak originated from the header section so now I could comment out parts of the header, re-run my snapshots, and observe the impact on memory. Sure enough after commenting out the sub component responsible for rendering the user menu I noticed the GC spring into action and the memory usage drop. Soon after I was able to trace my leak directly to a hook for handling authentication functionality, a hook intended to only in the browser but was being called server side during Next's server-side rendering.
As I investigated the hook I noticed a global array was being used to house callbacks. When running in the browser the authentication library would load and begin processing and clearing this queue. When running on the server the authentication library would never load and this queue would grow indefinitely. To make matters worse the callbacks would retain references to other data like our {ctaText, images, slug, ... } object in their closures and prevent the GC from being able to free this memory.
The Fix and The Takeaways
There are a handful of ways to ensure Next doesn't run your client only code server side. A common approach is to move it into an effect which is guaranteed to only run client side. Another approach is to check typeof window !== "undefined" and there are more. For us an effect made sense and with our new effect in place our page snapshot now looked like this:
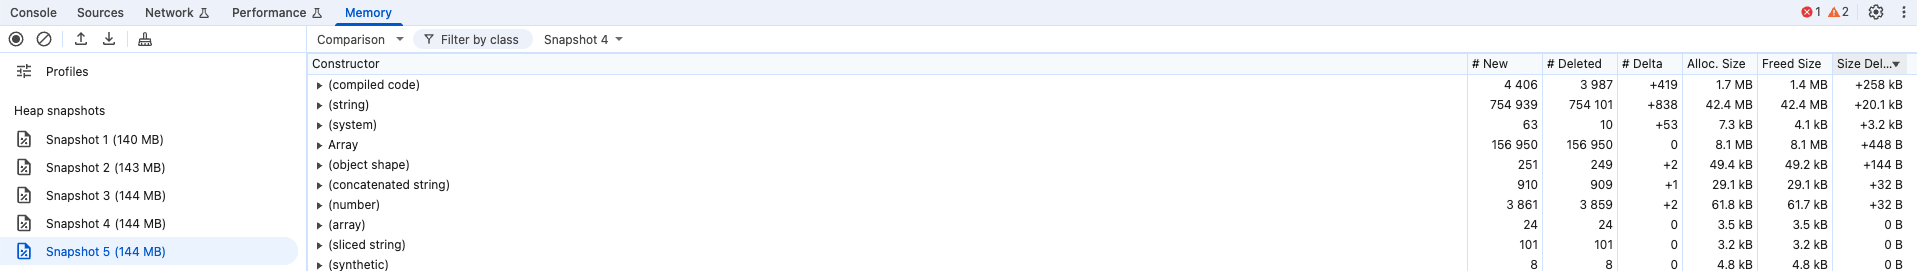
With the {ctaText, images, slug, ... } object no longer appearing at the top of the list, our freed sizes looking healthy, and memory usage stable 🎉.
Finally, with this change we've noticed a dramatic 60% reduction in the memory usage of our application.
In summary:
- Inspecting memory can feel foreign but these tools work and with some persistence you'll track down your leak
- Server side code executes in a long running web server process which is more susceptible to memory issues than a short lived client-side browser process where memory is reset on every page refresh
- There's a variety of ways GC can fail one of which is closures retaining references to objects
"use client"is not a directive that will prevent SSR from running code, you will need to use tools likeReact.useEffectortypeof window !=== "undefined"before executing client only code
Thanks for reading.